Monitoring
Docker
Use the Synology DSM's Package Center to download and install Docker:
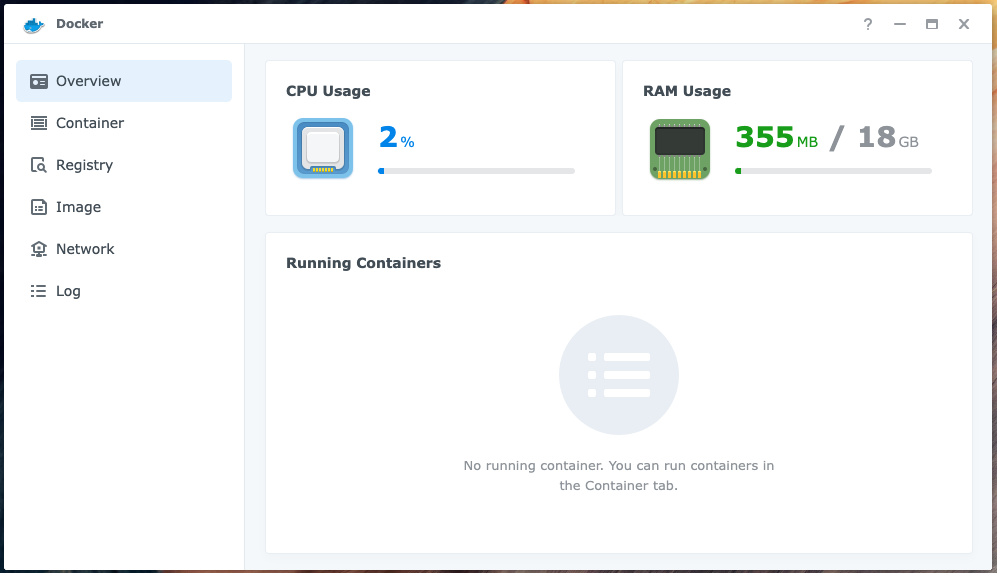
The installation will create a Shared Folder called docker: /volume1/docker
Prometheus
Create a directory for the image
Connect (SSH) to the Synology NAS, you should see something like:
admin@nas-1:~$
Create the directory for the Prometheus image:
cd /volume1/docker
mkdir prometheus
Configure Prometheus
Create a configuration file for Prometheus:
nano prometheus.yml
And update it as follows:
global:
  scrape_interval: 15s

  external_labels:
    monitor: "stake-pool-monitor"

scrape_configs:
  - job_name: "Prometheus"
    scrape_interval: 5s
    static_configs:
      - targets: ["192.168.101.3:12798"]
        labels:
          alias: "Relay 1"
          type: "cardano-node"
      - targets: ["192.168.101.3:9100"]
        labels:
          alias: "Relay 1"
          type: "node"
      - targets: ["192.168.101.4:12798"]
        labels:
          alias: "Relay 2"
          type: "cardano-node"
      - targets: ["192.168.101.4:9100"]
        labels:
          alias: "Relay 2"
          type: "node"
      - targets: ["192.168.101.5:12798"]
        labels:
          alias: "Relay 3"
          type: "cardano-node"
      - targets: ["192.168.101.5:9100"]
        labels:
          alias: "Relay 3"
          type: "node"
      - targets: ["192.168.102.3:12798"]
        labels:
          alias: "Core Node 1"
          type: "cardano-node"
      - targets: ["192.168.102.3:9100"]
        labels:
          alias: "Core Node 1"
          type: "node"
Run the image
Run Prometheus:
docker run -d --name=prometheus \
  -p 9090:9090 \
  -v /volume1/docker/prometheus/prometheus.yml:/etc/prometheus/prometheus.yml \
  prom/prometheus
Grafana
Create a directory for the image
Connect (SSH) to the Synology NAS, you should see something like:
admin@nas-1:~$
Create the directory for the Grafana image:
cd /volume1/docker
mkdir grafana
Run the image
Run Grafana:
docker run -d --name=grafana \
  -p 7001:3000 \
  -v /volume1/docker/grafana:/var/lib/grafana \
  grafana/grafana && \
  chown -R 472:472 /volume1/docker/grafana
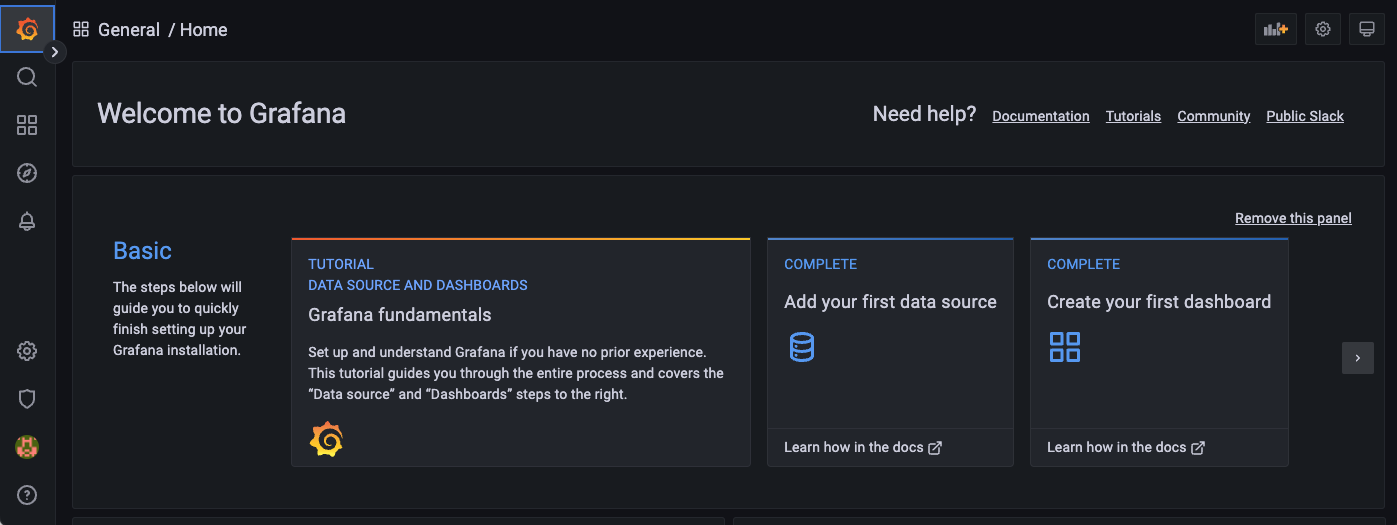
Navigate to:
http://192.168.101.2:7001/login
The default username is admin. The default password is admin.
You should see something like:
Configure Grafana
Add a data source
In the Grafana side menu select Configuration -> Data sources then click the Add data source button.
Choose Prometheus:
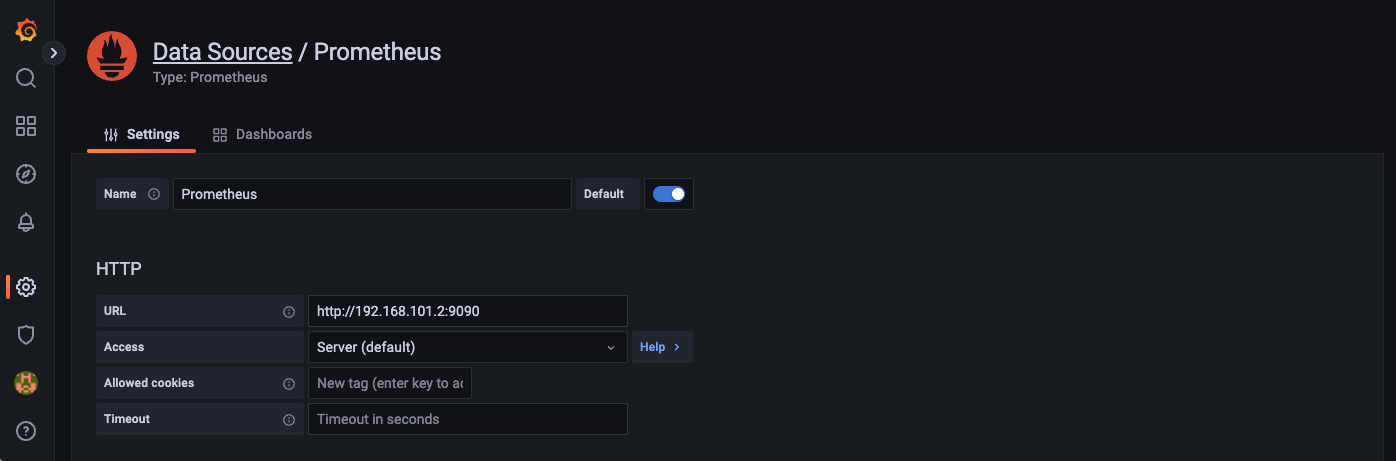
Enter the data source URL: http://192.168.101.2:9090
Note: The IP address for the Synology NAS is 192.168.101.2 and the Prometheus port number is 9090.
Then click the Save & test button.
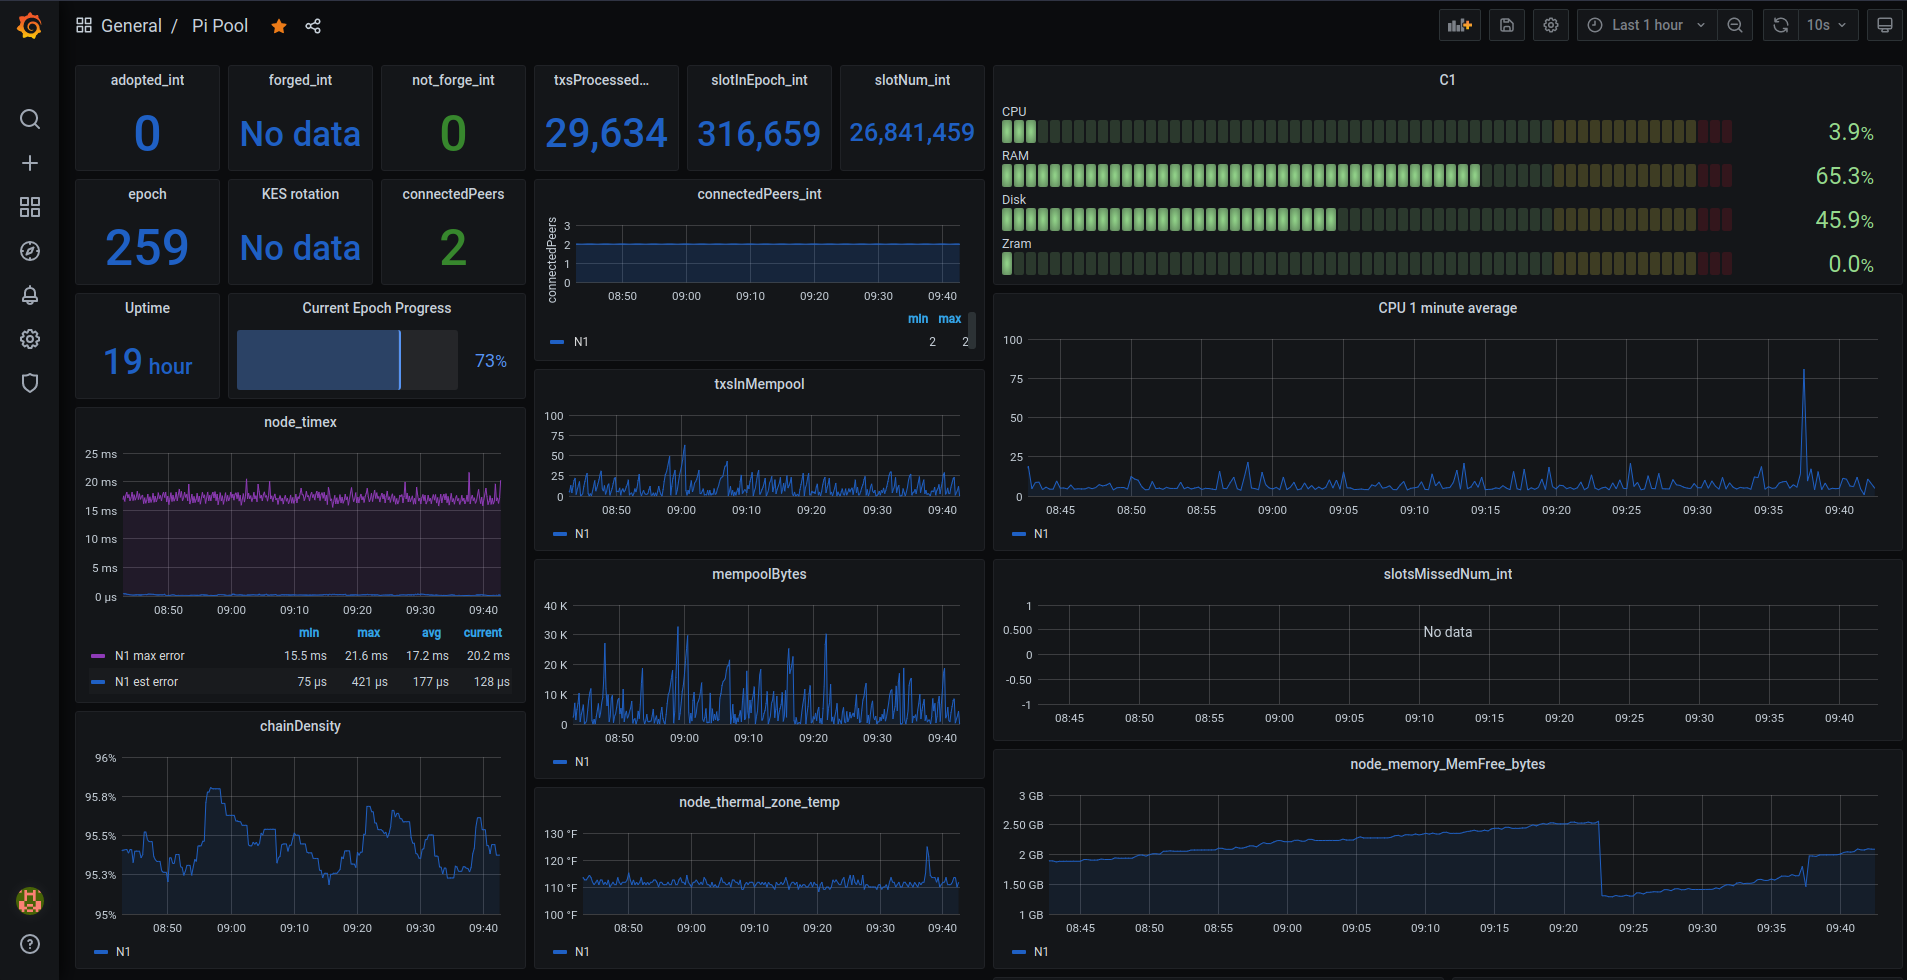
Sample dashboards
Pi Pool:
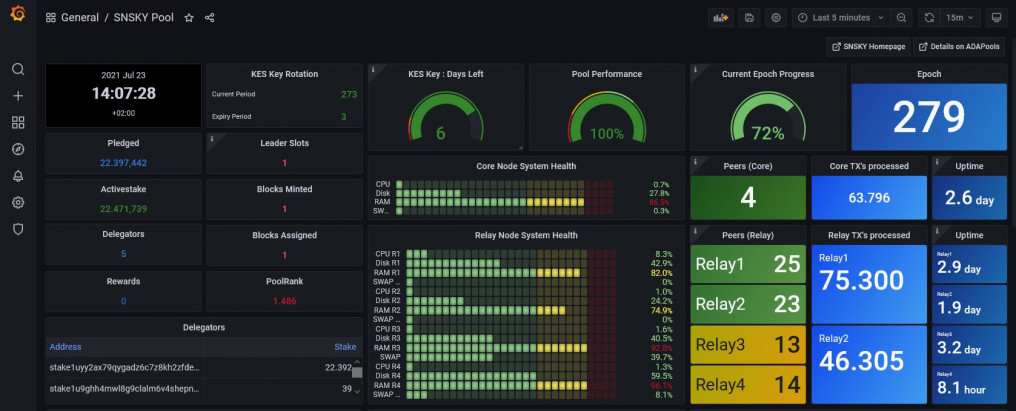
SNSKY Pool:
- Armada Alliance: Sample dashboards
- Pi Pool: Sample dashboards
- SNSKY: Sample dashboards
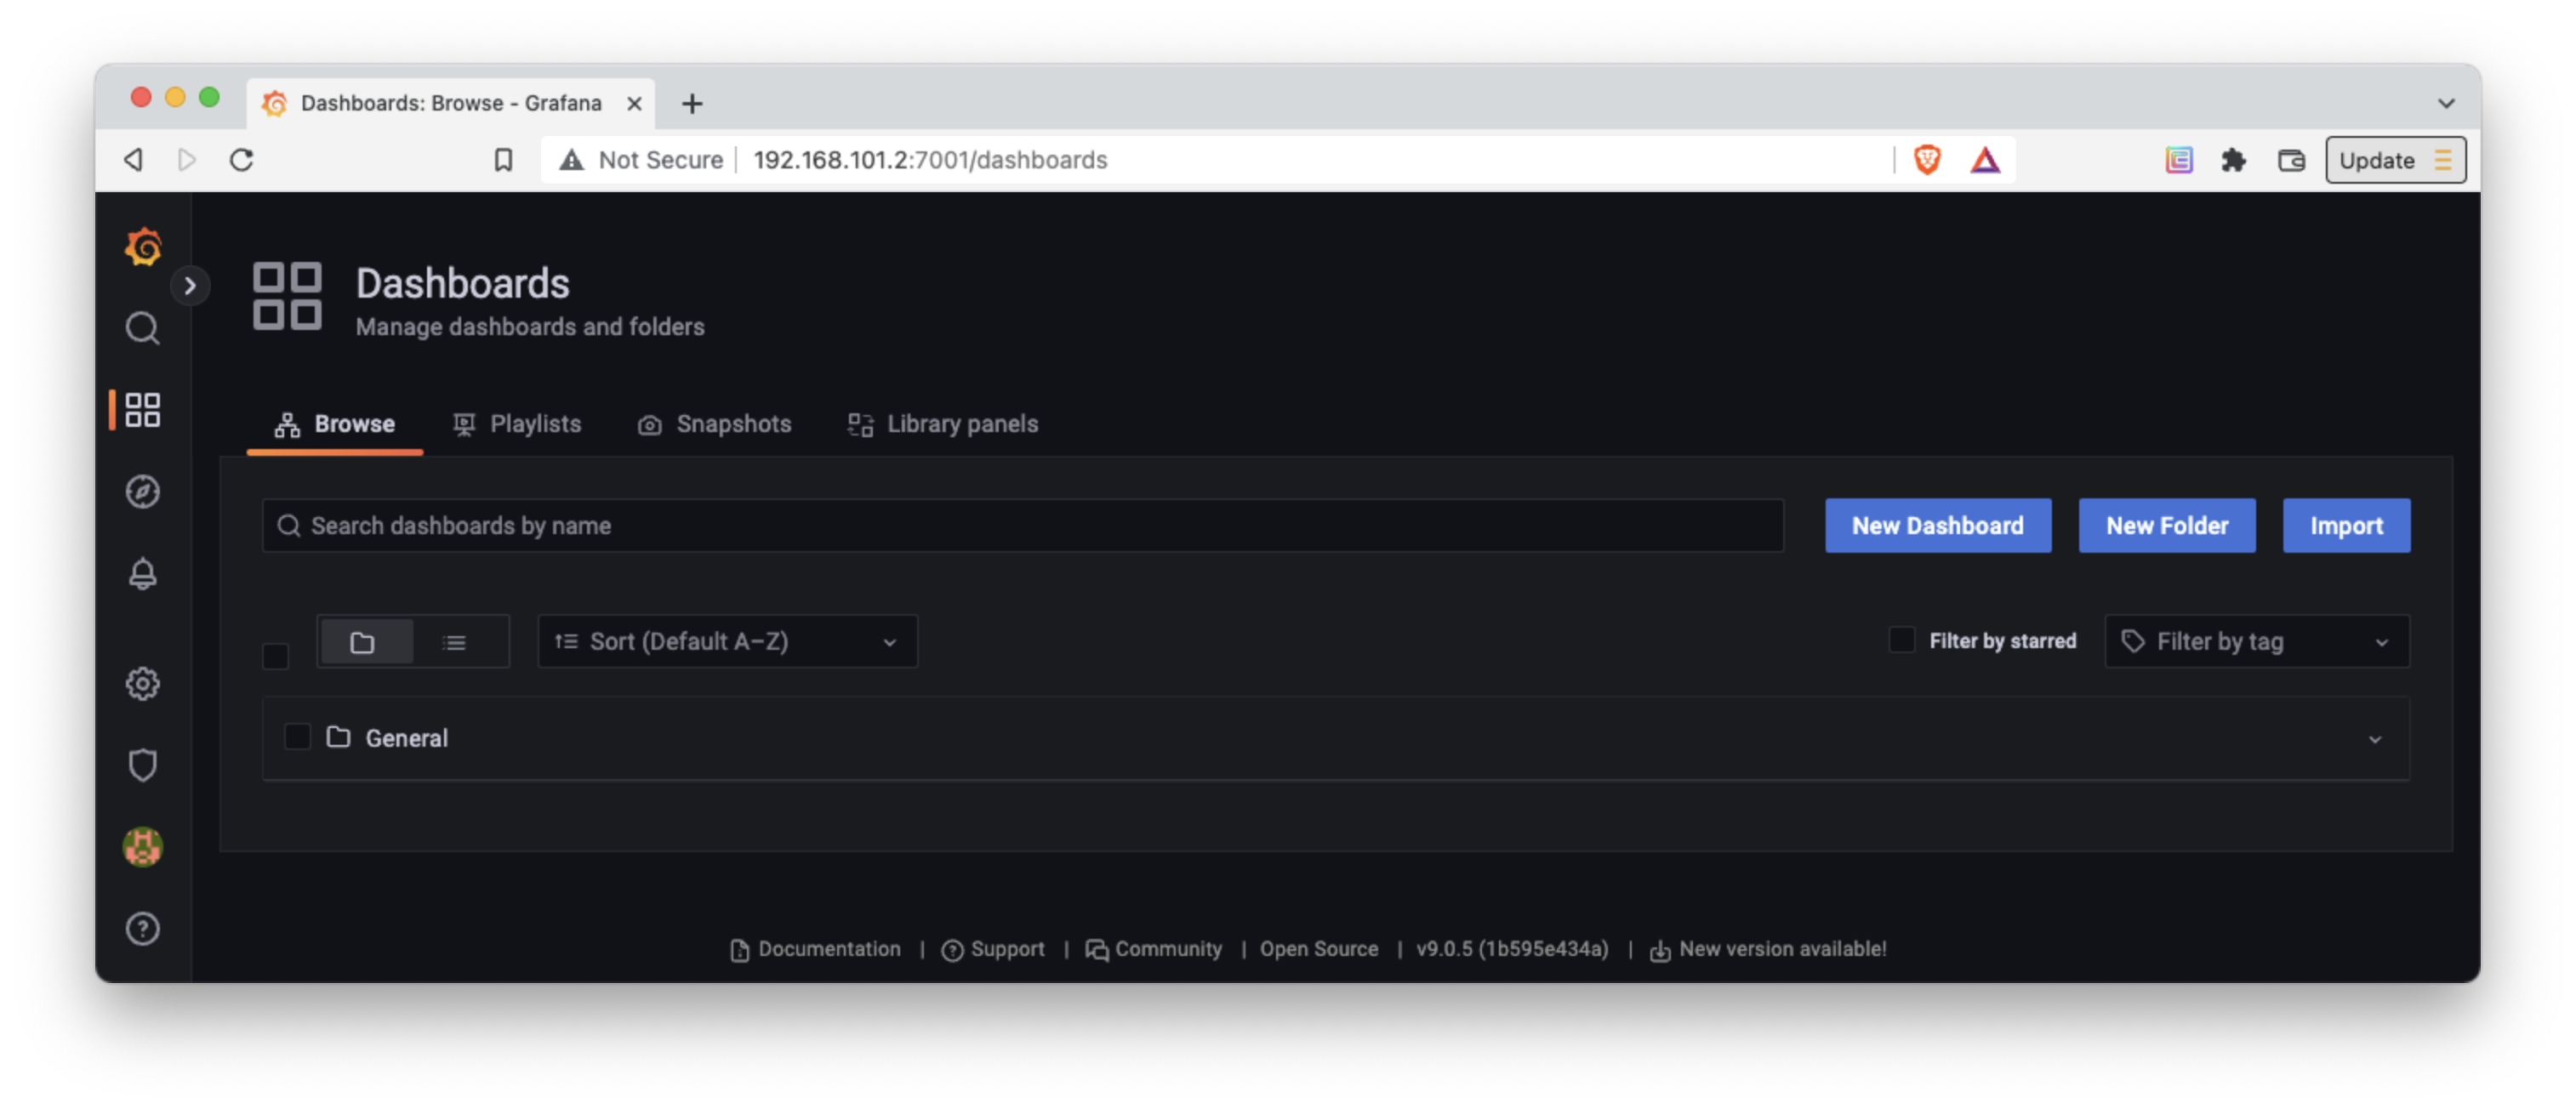
Import a dashboard
In the Grafana side menu select Dashboards then click the Import button.
Install a Grafana plugin
Use the following command to run a Shell in the Grafana container:
sudo docker exec -it grafana bash
You can use the Grafana CLI to install plugins.
For example, to install the Grafana Clock panel use the following command:
grafana-cli plugins install grafana-clock-panel
Resources
- Prometheus docs: Configuration
- Grafana docs: Configuration
- Grafana docs: About Grafana dashboards
- Grafana docs: Best Practices
- Pool Data docs: Pool Data API for Grafana